
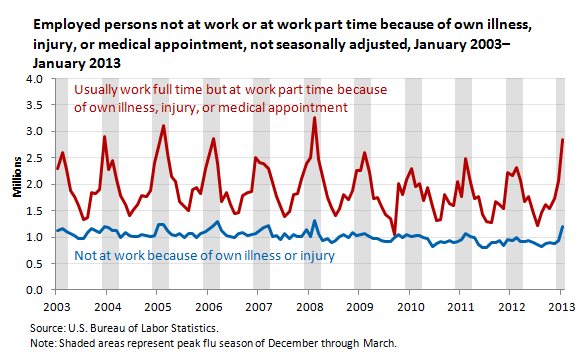
When you’re managing leave time and absenteeism among your workers, it’s important to understand many of the different statistical trends that relate to why workers don’t always show up to work the way you wish they would. Take a look at the graph below (source) because it’s a real eye-opener.
The most interesting thing about this graph are those gray-shaded areas that represent peak flu season months, which include December through March. As you can see, people calling out really spikes in those areas, meaning there’s a lot of illness at those times. That’s just one indication of something to keep in mind as you plan for when you’ll most likely need to cover people’s responsibilities more frequently.
How well does this chart reflect the experience of illness-related absences at your organization? It’s possible that you can’t answer that question because you may not even be properly tracking absences. If that’s the case, you’re not alone. The shocking truth is that less than half of organizations measure or manage employee absences effectively (source).
Even more shocking is the effect on your bottom line. One estimate says that employee absences amount to more than 3% of direct payroll costs (source). Another study puts that cost at $3,600 per hourly worker per year and $2,650 per salaried employee per year, noting that a company with 5,000 hourly employees could potentially reduce costs by more than $7.9 million (3.2% of direct payroll) by more effectively managing absenteeism (source).
There are more benefits to taking on more effective management of leave time and absenteeism. Your company could easily experience a nice boost in productivity because once everyone starts to become more aware of what’s happening around absenteeism, there will be an initial and almost natural reduction, which can be taken even further with more careful and aware management. More accurate management will also result in better compliance with leave policies (both government-mandated and company-based) and an overall reduction in disruptions to your organization’s vital operations.
Hopefully, the statistics presented above are motivating you to get a handle on effectively tracking and managing absenteeism at your organization. The good news is that with a solution like CaptureLeave, tracking absenteeism is a cinch because you have the flexibility to quickly get into the web-based system and enter data about employee absences, then run reports that will help you understand both the nature of absenteeism in the unique context of your company which you can then translate into hard numbers that impact the bottom line.
Your company tracks all kinds of employee-related costs very carefully. Isn’t it time to track the cost of absenteeism as well? Even better, isn’t it time to start managing it more effectively? Explore the CaptureLeave website to see what this solution can do for you.
Recommended articles


[…] Work Absences by the Numbers […]